How to use JavaScript to visualise custom maps
In our day to day life, maps are everywhere. From finding out an isolated restaurant to tracking your Zomato order you need maps for sure.
Applications of maps are not limited to just navigation they are also one of the best ways to visualize complex data.
There are numerous APIs and libraries you can find on the internet,
but one problem that arises with most of them is that they provide very limited options for customisation.
I'm going to introduce MapBox GL JS, It is a client-side JavaScript library for building web maps and web applications. You can use Mapbox GL JS to display Mapbox maps in a web browser or client, add user interactivity, and customize the map experience.
Why MapBox ?
It is pretty easy to implement very complex tasks with it, also it provides numerous options for
customisation which is extremely useful to build interactive maps .
Now, building worlds maps or country maps is pretty easy, but what if you have a
specific zone or a district?
Then all you would need is to have a GeoJson file of the area you need to visualise.
What is GeoJson?
GeoJSON is a way of representing geographic data. It is pretty similar to Json. It provides a way to add meaning to coordinates of some specific area.
Lets start with the implementation, i would suggest you look at my jsFiddle Link for a better understanding of coding this.
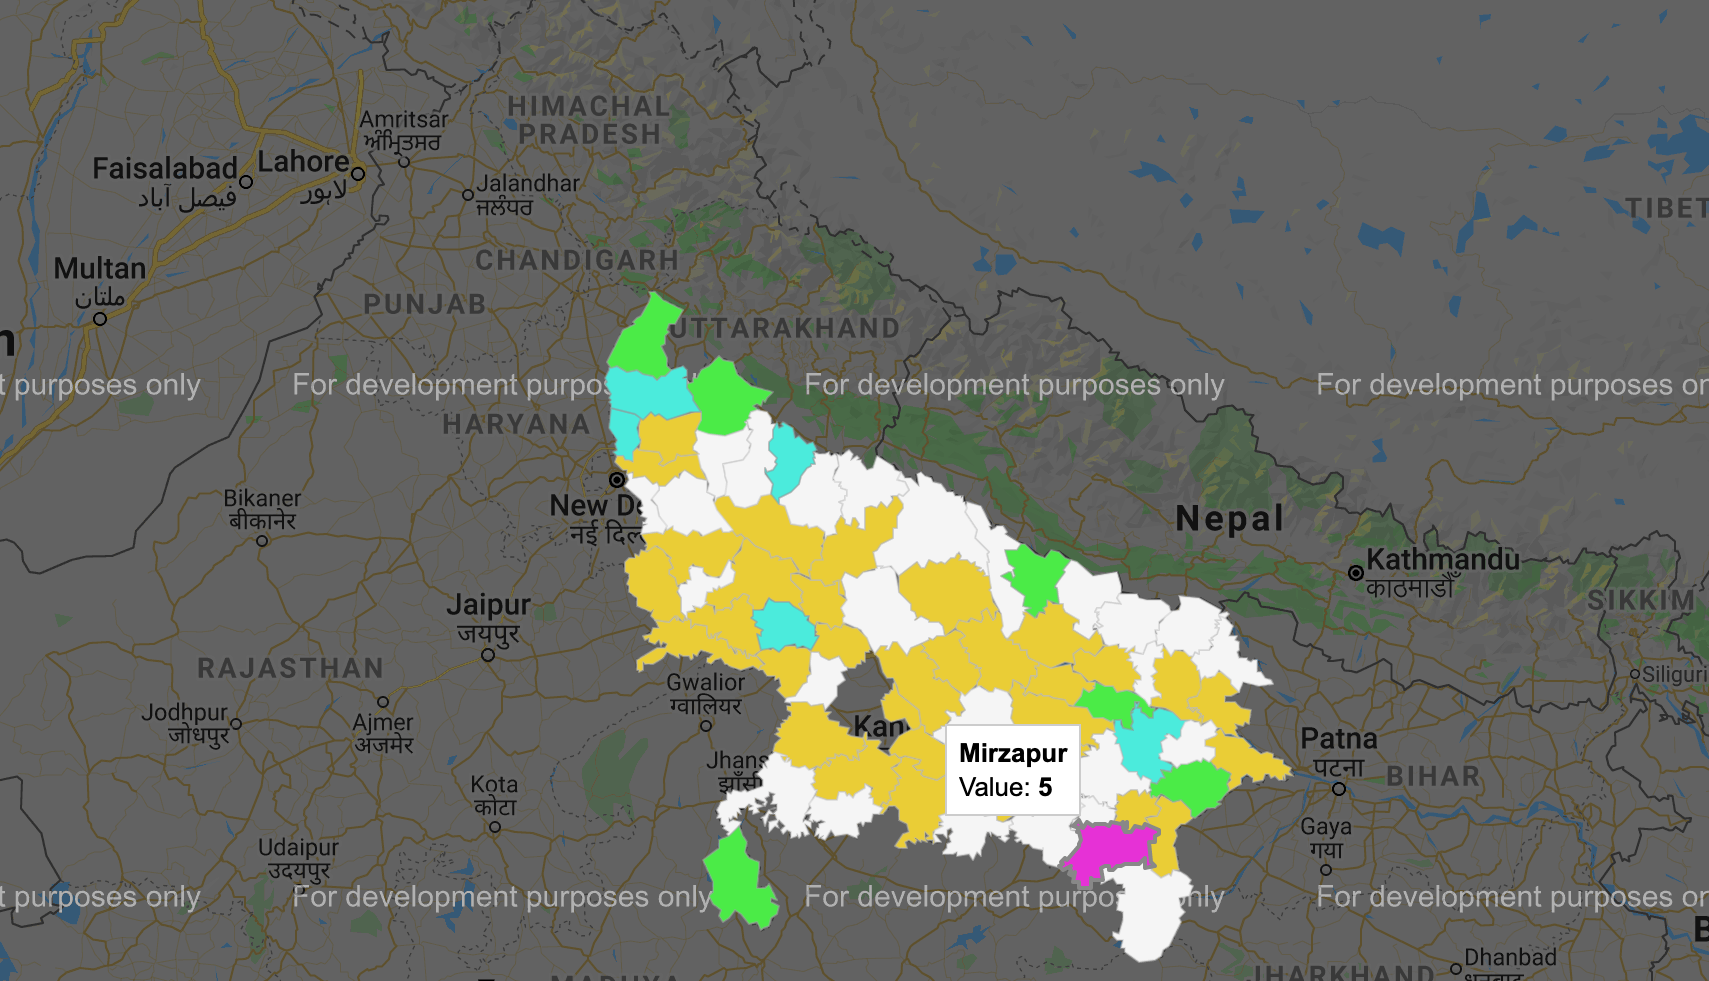
Here is a political party-wise representation of winners in UP Ac elections using heat map i have exported GeoJson data of all districts of Uttar Pradesh as it is not available as default.
Hereby using map.addSource i have added the source and ids of my data. to make it more interactive i have colour-coded each party and set boundaries using addLayer function.